

At our recent iaptus User Group our Data Research Team ran workshops to explore how iaptus data can support both Adult and Children and Young People’s (CYP) mental health services in addressing health inequalities.
Watch the full health inequalities workshop:
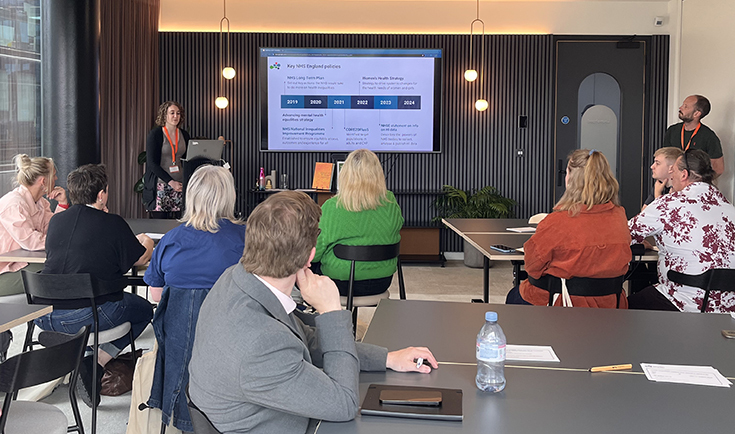
Over the last few years, NHS England have set out key policies to tackle health inequalities across the country, including:
- Advancing Mental Health equalities strategy
- NHS NIIP is responsible for setting the direction for tackling healthcare inequalities
- CORE20Plus5 approach
- Women’s health strategy
- NHSE statement on info on Health Inequalities data which standardises the approach for collecting, analysing and publishing information on health inequalities by specifying a key set of data indicators that trusts and ICBs will be expected to monitor and report on within their annual reports.
Learn how Hammersmith, Fulham, Ealing and Hounslow (HFEH) Mind, uses data within iaptus to identify and tackle health inequalities in West London:
So, which dashboards within iaptus can support you in addressing health inequalities?
Referrals & discharges dashboards:
In these dashboards you can break down referrals and discharges in various ways.
There are a number of tabs showing different metrics which can be filtered to only show data from particular patient groups such as gender identity, age or ethnic category.
Using the Referrals and discharges dashboards you can:
- View reliable recovery for different groups. This tab very simply displays outcomes for different patient groups over a given time period, which is useful for immediate, high level comparison across a given characteristic.
- View the average number of contacts for different characteristics. This tab also contains more complex data such as this visualisation looking at mean sessions.
- View average change in score for different characteristics. Or for a more complex view at outcomes, there are tools such as this displaying changes in scores. Again, different characteristics can be selected so that each category can be compared side to side to highlight differences
- View recovery broken down for different characteristics. When a more nuanced view is needed you can examine the relationship between 2 different characteristics (e.g, split by ethnicity and age).
Using the Contacts dashboards you can:
- Gain information around volume and timing of appointments, with the main application for Health Inequalities around attendance.
- Examine attendance and DNA rates by some characteristics. Not all characteristics are available in every dashboard, if this presents you with a problem then raise a support log
- Using the IAPT wait times dashboards you can:
- View waiting times for different groups. These dashboards look purely at 1st and 2nd contacts which take place on an episode of treatment. Because it is looking across modalities this must be taken into account when looking at the data. Once again, allows comparison across groups and could highlight any significant differences.
As part of the ongoing “iaptus insights” pilot project we have developed the Maps dashboard. For more information on iaptus insights please email iaptus.insights@mayden.co.uk.
Using this exciting new mapping tool you can:
- View data plotted geographically at LSOA and MSOA (lower and middle super output areas) level across the area covered by your service. 2021 census data has been imported so that you can view local population data such as population density alongside service metrics such as reliable recovery. This is a powerful analysis tool which can highlight areas of inequality, particularly when combined with knowledge of the local area.
- There are also options with the workbook to compare maps alongside each other. This allows easy exploration of metrics and census data to find potential links which may warrant further investigation. Another application is that it gives a very easy way to look at performance of different teams when split geographically
If you would like any further information on how iaptus can support your service in reporting on health inequalities, please email us at iaptus.insights@mayden.co.uk or raise a support log with your account manager.