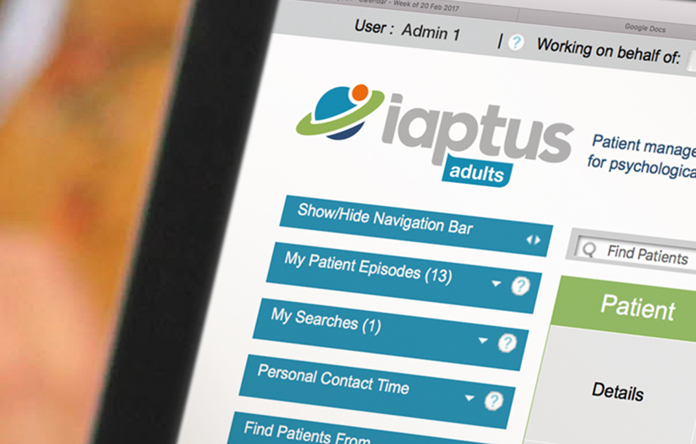
Each month, the HSCIC publishes measures from the analysis of IAPT services’ data submissions. To help our customers to understand how their services are performing against these measures, we’re rolling out a new set of interactive dashboards within iaptus.
The new dashboards contain 126 different data measures, which we have categorised into the following broad categories:
Referrals
First Assessment
First Treatment
Second Treatment
Appointments
Discharges
Below you’ll find a quick introduction to three of these dashboards as examples of what you can expect to see.
6&18wk enter treat %: Proportion of referrals that entered treatment in the period and wait to first treatment (6 & 18 week wait)
This dashboard allows you to see the proportion of referrals that entered treatment within a selected reporting period, as well as the length of their wait from referral to first treatment.
The results are broken down as follows:
those who waited less than 6 weeks
those who waited less than 18 weeks
The results are shown as both the number of referrals and as a percentage of all the referrals that entered treatment in the reporting period.

No 1st treat: Referrals yet to have a first treatment at the period end
This dashboard shows the number of referrals yet to have received their first treatment at the end of your chosen reporting period.
The results show the total number of referrals still waiting for treatment, and are broken down by wait length:
2 weeks
4 weeks
6 weeks
12 weeks
18 weeks
more than 18 weeks
more than 90 days

2nd treat: Referrals with second treatment appointment in the period
This dashboard allows you to see the number of referrals receiving their second treatment appointment in the chosen reporting period. It then shows you, of these referrals, the wait time between first and second treatment, shown as either:
Over 28 days
Over 90 days
The wait times are also given as the mean, median and mean average wait time.

We have created an in-depth guide to using the dashboards which we will share with all of our customers shortly. If you have any questions, please contact your account manager via the support log.
